
Statistics is essentially the application of science to data. Hence, applied multivariate statistical analysis is often referred to as “Data Science.” In most cases, “Analytics” or “Advanced Analytics” are analogous terms. These and other terms such as “Business Intelligence,” “Big Data,” “Machine Learning (ML),” “Neural Networks,” “Deep Learning,” and “Artificial Intelligence (AI)” are being used with increasing frequency in recent years.
While the advent of automated machine learning applications have made highly sophisticated algorithms readily implementable by anyone regardless of their level of statistical acumen, the following facts remain highly relevant to all analytics practitioners:
 Substantial pitfalls in assessing statistical validity exist which are situation-based, requiring the contextual understanding of domain experts and a core understanding of multivariate statistics.
- Feature engineering — best done with input from domain experts — is often more important to improving multivariate analyses than are algorithm selections and hyperparameter tunings.

While Adret LLC is happy to assist you with your analytics implementations, we also strongly believe in training clients so as to address the critical need to cross-pollinate statistical expertise and domain knowledge. To this end, we offer a number of training options* in addition to our consulting services:
 A 1-hour talk on assessing statistical validity (perfect for lunch-and-learn events).
- Customizable training on multivariate analytics and ML. Can range from a full-day short course to a 5-day data science bootcamp. The bootcamp includes hands-on Python coding and model assessment examples.
The short course and bootcamp are designed to help audiences gain an appreciation for the power, applicability, and pitfalls of multivariate computational statistics. They consists of five modules:
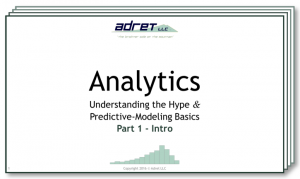
- Part 1 – Intro: provides a high-level, holistic overview of the material in subsequent modules.
- Part 2 – Data Wrangling: reviews data types, data preparation, and considerations necessary for building databases.
- Part 3 – Diagnostics: overviews data and model diagnostic techniques necessary for building valid multivariate models.
- Part 4 – Descriptive Analytics: introduces multivariate methods such as component analysis, clustering, latent variable models, and discriminant analysis.
- Part 5 – Predictive Analytics: compares predictive modeling options such as multivariate regression, decision trees, random forests, and neural networks.
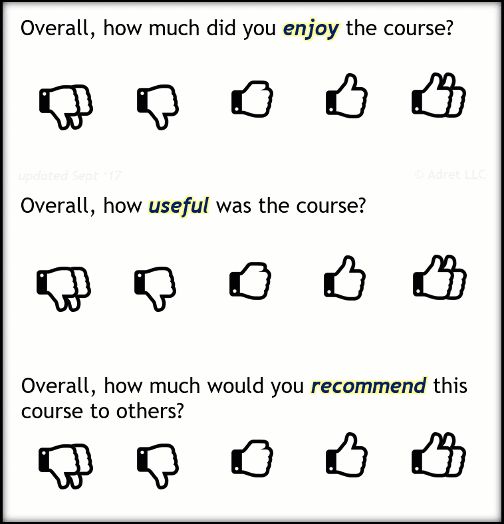 The course has already been given at a few publicly-traded upstream O&G companies. Feedback from the short-course attendees regarding the course’s enjoyability, usefulness, and whether they would recommend it to others has been very positive and is summarized in the adjacent graphic.
Contact us for a quote if you are interested in hosting an in-house presentation of the talks at your organization. Collectively, the modules are designed to help managerial and technical staff appreciate how multivariate analytics might benefit their operations.
Testimonials:
- “Great communication – Great displays” – Manager, Exploration Technology
- “[The instructor was] very passionate about this subject which made the class enjoyable.” – Geologist
- “Enjoyed the combination of statistics, O&G experience, and culture.” – Engineering Adviser
- “The material & explanations were thorough without being cumbersome.” – Geologist
- “Awesome talk! Particularly the 3rd & 4th parts were very helpful and relevant to the industry.” – Geophysicist
- “[He] knew the material thoroughly, … was never stumped by a question and offered valuable insights” – Data Architect
- “Great presentation and statistics overview.” – Senior Geologist
Multivariate techniques can provide tremendous insights whether dealing with small, business-critical projects or big data sets. Regardless of the size of your data, multivariate analytics can help you cut through the clutter.
Do you wonder whether multivariate analytics can help address your business needs? Is it possible that your feature engineering might be improved? Let’s talk.
Have a mountain of data?
Let’s find the bright side of it!
![]() Adret LLC’s founder Andrew Silver earned an M.S. Analytics from Texas A&M University’s Department of Statistics and also has an M.S. Earth Science from Rice University. His Ph.D. Geophysics is on-schedule to be completed in 2027. His M.S. Analytics capstone project extracted metrics from millions of rows of data from thousands of wells in the South Texas Eagle Ford trend; incorporated multidisciplinary sources; and culminated in a valid, parsimonious multivariate model. The model was then used to assess the financial impact of various geologic indicators, drilling practices, completion styles, and production methods.
Adret LLC’s founder Andrew Silver earned an M.S. Analytics from Texas A&M University’s Department of Statistics and also has an M.S. Earth Science from Rice University. His Ph.D. Geophysics is on-schedule to be completed in 2027. His M.S. Analytics capstone project extracted metrics from millions of rows of data from thousands of wells in the South Texas Eagle Ford trend; incorporated multidisciplinary sources; and culminated in a valid, parsimonious multivariate model. The model was then used to assess the financial impact of various geologic indicators, drilling practices, completion styles, and production methods.

The TAMU MS Analytics is provided through a partnership between the TAMU Department of Statistics and the Mays Business School. The resulting program focuses on providing a diverse statistical toolkit which can be applied broadly to find valid solutions to strategic business problems. Informed by this approach, Adret’s training and analytics services have a central focus on assessing validity and providing value.
“… In practice, multivariate data sets are common, although they are not always analyzed as such. But the exclusive use of univariate procedures with such data is no longer excusable given the availability of multivariate techniques and inexpensive computing power to carry them out.”
-Rencher & Christensen (2012), Methods of Multivariate Analysis, 3rd Ed.


* Lecture costs will vary depending on location (i.e., travel costs), availability, and audience size. In some cases, the first lecture (Part 1) may be offered at a reduced cost or free of charge. For the 1-day course, rates start at $300/person with a minimum of 10 attendees. Discounts available for larger groups. If interested, please contact us for a quote.
We love our community and country. Government agencies may be eligible for free or substantially discounted access to our lectures.